Basic Theory
A common rule of thumb in aviation is that a reciprocating aircraft engine produces about 0.5 horsepower per cubic inch of displacement. This estimate is frequently quoted, yet the math behind it is seldom shown. In this post, I will walk through the thermodynamic reasoning behind that figure and explore the assumptions that make it work.
We’ll focus specifically on four-stroke reciprocating engines, excluding turbines and jets.
For an engine operating at a rotational speed of f (in RPM), the mass flow rate of air—expressed as weight per minute—is given by:
W_a = D \times \frac{f}{2} \times \rho\hspace{2cm}(1)where
- D is the total displacement volume of the engine (in cubic inches),
- f is the engine speed in RPM,
- \rho is the air density (in lb/in^3).
The \frac{f}{2} factor accounts for the four-stroke cycle: each cylinder draws in air only every other revolution. For example, at 2700 RPM, each cylinder experiences 1350 intake strokes per minute. The other 1350 are compression strokes (with combustion and exhaust).
Air-Fuel Mixture and Stoichiometry
Next, we consider the addition of fuel, typically through a carburetor or fuel injection system. For Avgas, the stoichiometric air-to-fuel ratio is approximately 14.7:1 by weight. We’ll denote this ratio as:
S_r = 14.7.\hspace{2cm}(2)This means 14.7 pounds of air is required for complete combustion of 1 pound of fuel. Combustion at the stoichiometric ratio yields the maximum energy output per unit of fuel, but in real-world engine operation, this is often not the most practical setting. Running exactly at stoichiometric ratio can cause the engine to operate at very high temperatures, potentially leading to cylinder head damage or detonation. To manage engine temperature and longevity, engines are typically operated either rich of peak (more fuel than stoichiometric) or lean of peak (less fuel than stoichiometric), depending on specific situations. To keep things simple, this theoretical calculation assumes perfect stoichiometric combustion.
Using this, the fuel mass flow rate is:
W_f = \frac{W_a}{S_r}.\hspace{2cm}(3)Thermal Power from Combustion
The energy released from combustion depends on the fuel type. For gasoline (and Avgas), stoichiometric combustion yields about 43 MJ/kg, or 14.8\times 10^6 ft-lb/lb. This is known as calorific value, and we will write it as Q_m.
Thus, the total thermal power (which we will write as P_t) released by combustion is:
P_t = \frac{W_a}{S_r} \times Q_m.\hspace{2cm}(4)Only a fraction of this energy is converted to mechanical work at the crankshaft. The rest is lost to exhaust heat, friction, and other inefficiencies. For most aircraft piston engines, the thermal efficiency \eta ranges from 25% to 30%.
The mechanical (crankshaft) power output is then:
P_c = \eta\times \frac{W_a}{S_r} \times Q_m.\hspace{2cm}(5)Substituting equation (1) into this, we get the expression for crankshaft power:
P_c = \eta \times D \times \frac{f}{2} \times \rho \times Q_m \times \frac{1}{S_r}. \hspace{1cm}(6)Numerical Example
Let’s compute power output for 1 cubic inch of displacement (D=1) at standard conditions. The density of air at sea level is 0.0765 lb/ft^3, or 4.4\times 10^{-5} lb/in^3. We will use the following values:
- Engine speed f=2700 RPM
- Density of air \rho=4.4\times 10^{-5} lb/in^3
- Calorific value Q_m=14.8\times 10^6 ft-lb/lb
- Stoichiometric ratio S_r=14.7
- Thermal efficiency \eta=0.28
Plugging into equation (6):
P_c = 0.28 \times 1 \times \frac{2700}{2} \times 4.4\times 10^{-5} \times \frac{14.8\times 10^6}{14.7}=16,745 ~~{\rm ft\cdot lb/min.}Since 1 horsepower = 33,000 ft-lb/min:
\frac{16,745}{33,000} \approx 0.51 ~~{\rm hp/in^3}.This is the commonly cited figure of 0.5 horsepower per cubic inch, which applies specifically at 2700 RPM. Lower RPM yields lower power, and higher RPM yields more—though aircraft engines are typically limited to 2700 RPM to keep propeller tip speeds subsonic. This limitation is one reason why the 0.5 hp/cubic-inch value is so prevalent in aviation circles.
Fuel Consumption
Combining equations (1) and (3), the fuel flow rate is:
W_f = D \times \frac{f}{2} \times \rho\times \frac{1}{S_r}. \hspace{2cm}(7)Again, using D=1:
W_f = 1 \times \frac{2700}{2} \times 4.4\times 10^{-5}\times \frac{1}{14.7} = 0.004~~{\rm lb/min} = 0.24~~{\rm lb/hr}.The density of Avgas is approximately 6 lb/gal, giving:
\frac{0.24}{6} \approx 0.04 ~{\rm gal/hr/in^3}.This is the fuel consumption per cubic inch, at 2700 RPM. This number goes hand in hand with the 0.5 hp/cubic-inch value.
Power per Unit Fuel
Finally, dividing crankshaft power by fuel weight flow yields:
\frac{P_c}{W_f} = \eta \times Q_m = 0.28 \times 14.8\times 10^6 = 4.14\times 10^6~{\rm ft\cdot lb/lb}.In horsepower,
\frac{4.14\times 10^6 }{33,000} = 125.5~{\rm hp/lb/min.}Since the density of Avgas is 6 lb/gal, in terms of gallons per hour:
125.5 \times 6 \approx 753 ~{\rm hp/gal/min} \approx 12.5~{\rm hp/gal/hr.}This is the power per fuel flow. This value is independent of RPM, since both power and fuel flow scale linearly with RPM and cancel out in the ratio.
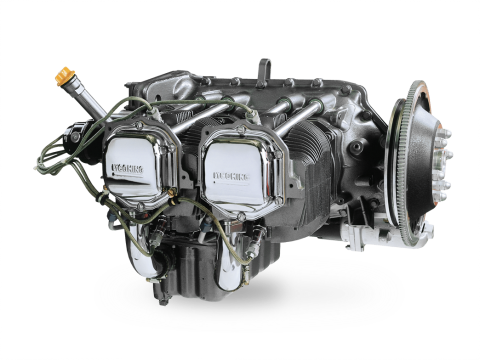
Real-World Examples: O-320 and O-540 Engines
Let’s apply this to actual engines. Take the Lycoming O-320, for example. It has a total displacement of 320 cubic inches. Using the earlier estimate of 0.5 hp per cubic inch, we get:
320 \times 0.5 = 160~{\rm hp}.This matches the rated maximum power output of the O-320 engine. Fuel consumption can similarly be estimated using 0.04 gal/hr per cubic inch, giving:
320 \times 0.04 = 12.8 \approx 13.0~{\rm gal/hr}.Now consider the Lycoming O-540 engine. With 540 cubic inches of displacement. The corresponding values are:
540 \times 0.5 = 270~{\rm hp} 540 \times 0.04 = 21~{\rm gal/hr}.These values are in agreement with the published specifications of these engines, reinforcing the validity of the 0.5 hp/in^3 and 0.04 gal/hr/in^3 rules of thumb—particularly at 2700 RPM under standard conditions.
Automotive Engines
Automotive engines typically have smaller displacements but operate at much higher RPM compared to direct-drive aircraft engines. For example, a 2.5-liter (152 cubic inch) Toyota engine might be rated for a maximum of 6600 RPM. Thanks to electronic ignition controls, advanced fuel management, and greater thermodynamic optimization, automotive engines often achieve slightly higher heat engine efficiencies—around 30% is a reasonable estimate.
The energy content of autogas is nearly identical to that of Avgas, so the earlier calculations still apply. If we plug in the numbers for this engine into equation (6), assuming \eta = 30\% and D=1, we arrive at:
P_c = 0.3 \times 1 \times \frac{6600}{2} \times 4.4\times 10^{-5} \times \frac{14.8\times 10^6}{14.7}=43,856 ~~{\rm ft\cdot lb/min.}Dividing by 33,000 gives:
\frac{43,856}{33,000} = 1.3 ~~{\rm hp}.This is about 2.5 times the power density of a typical direct-drive aircraft engine, which is exactly the ratio between 6600 RPM and 2700 RPM.
This highlights a key point: the often-quoted figure of 0.5 hp per cubic inch is not a fundamental limit, but rather a consequence of operating at 2700 RPM, which is a typical upper limit for direct-drive aircraft engines due to propeller constraints. Automotive engines, unconstrained by propeller speed limits, can achieve much higher power densities simply by running faster.
As a result, the 2.5-liter (152 cubic inch) Toyota engine will produce 152 \times 1.3 \approx 200~{\rm hp}.
Rotax 912: High-RPM Aviation Engine
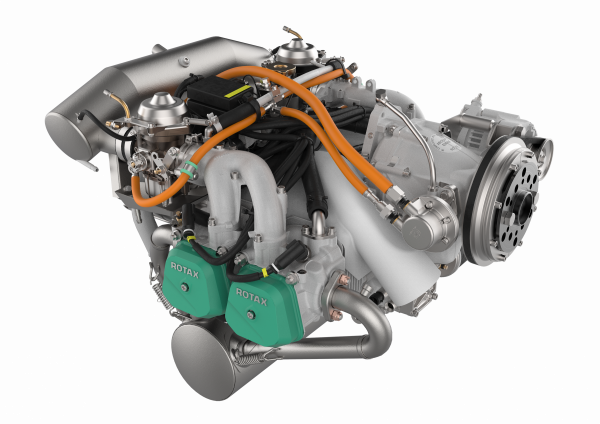
The Rotax 912 is a notable example of an aviation engine that, unlike traditional direct-drive engines, operates at higher speeds—up to 5800 RPM, comparable to automotive engines. To accommodate a conventional propeller speed of 2700 RPM, the engine incorporates a reduction gearbox. For purposes of power generation, however, the engine’s crankshaft RPM (5800) is what matters.
Like automotive engines, the higher RPM of the Rotax 912 enables greater power output per unit displacement. The engine has a total displacement of 83 cubic inches—approximately one-fourth the size of the O-320. However, it benefits from a slightly improved thermal efficiency of 31% due to its modern design and liquid cooling.
Using the same thermodynamic framework as before, the power density of the Rotax 912, using equation (6), works out to:
P_c = 0.31 \times 1\times \frac{5800}{2} \times 4.4\times 10^{-5} \times \frac{14.8\times 10^6}{14.7} = 39,825 ~{\rm ft\cdot lb/min}.In horsepower,
\frac{39,825}{33,000} \approx 1.2~{\rm hp/in^3}.This is 240% of the 0.5 hp/in^3 typical of direct-drive engines, and very close to automotive levels. The fuel consumption is also higher per cubic inch due to the elevated RPM. From equation (7), this works out to:
W_f = 1 \times \frac{5800}{2} \times 4.4\times 10^{-5}\times \frac{1}{14.7} = 0.087~{\rm lb/min} = 0.52~{\rm lb/hr} = 0.087~{\rm gal/hr}.Therefore, the total performance of the Rotax 912 engine is:
- Power output: 83\times 1.2 =100 {\rm hp}
- Fuel flow: 83\times 0.087=7.2 {\rm gal/hr}
Both values align well with the actual published specifications of the engine, confirming the validity of this thermodynamic approach. The Rotax 912 illustrates how RPM, not displacement alone, governs the specific power output in internal combustion engines.
Throttle Effects on Air Density and Engine Power
In the previous calculations, we assumed that the density of the intake air is equal to that of the outside atmosphere. This assumption holds true only when the throttle valve is fully open, allowing unrestricted airflow into the engine. But what happens when the throttle is gradually closed?
Closing the throttle restricts airflow, causing a drop in pressure downstream of the throttle plate—this is reflected on the manifold pressure gauge. As the pressure drops, the air density \rho entering the cylinders also declines, even though the outside air remains unchanged. The throttle plate acts as a flow restriction, creating a partial vacuum in the intake manifold.
Since our power equation is directly proportional to \rho, any reduction in intake density results in reduced power output. With a fixed load, this leads to a decrease in engine RPM. In turn, the lower RPM further reduces airflow and power, potentially creating a runaway deceleration scenario that can eventually bring the engine to a stop.
The reverse is also true: opening the throttle increases manifold pressure and intake density, which raises power and RPM. This could, in theory, lead to uncontrolled acceleration. However, in practical systems, the mechanical load (such as a propeller) typically increases with RPM, providing a stabilizing feedback mechanism. This dynamic load response helps prevent runaway conditions in either direction.
We’ll explore this stabilizing effect in more detail when we examine propeller load curves in a later section.
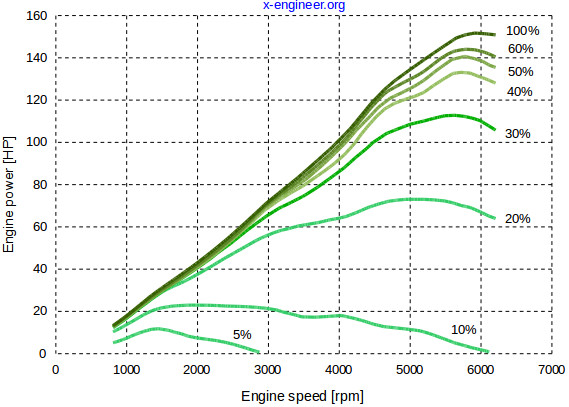
Power vs rpm
As indicated by equation (6), the power will scale linearly with rpm at a constant manifold pressure. But it does not continue indefinitely. The power will reach a maximum, and then start declining at higher rpm values. This is shown in the adjacent figure. This is due to increasing friction losses and lower combustion efficiencies at higher rpm. This is usually the maximum permissible rpm of the engine. Similarly, power vs manifold pressure at a fixed rpm will also show a linear relationship. Manifold pressure is normally limited to atmospheric pressure, but in turbo boosted engines, it can go higher.
It’s also worth noting that it is possible to run the engine at higher rpms and higher powers than it is rated for, but it will most likely result in permanent damage. For example, if the load is too light and the throttle is fully open, the rpm can exceed the maximum limit.
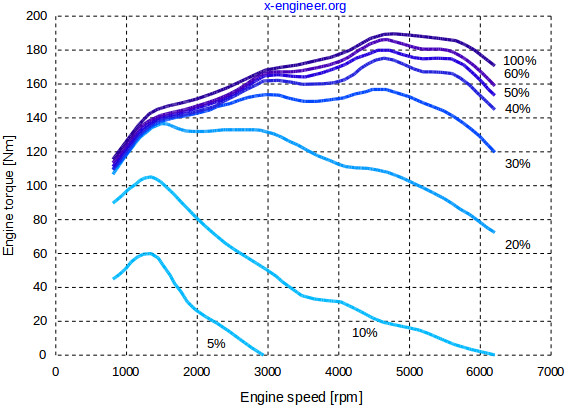
Torque vs rpm
Torque is the rotational force imparted by the crankshaft. It is related to power and rpm as follows:
P_c = T \times f. \hspace{2cm}(8)Comparing this to equation (6), we can see that torque can also be expressed as
T = \eta \times D \times \frac{1}{2} \times \rho \times Q_m \times \frac{1}{S_r}. \hspace{1cm}(9)All of these parameters are nearly constant at a specific throttle setting, which means torque should be constant regardless of rpm or power.

In practice, that is not exactly true. Torque increases slowly with rpm, though not as linearly as power increases with rpm. It reaches a maximum and then declines again.
Aircraft vs Automotive Engines
As we previously calculated, direct drive aircraft engines typically have a power density of about 0.5 horsepower per cubic inch. In contrast, automotive engines achieve much higher power densities. However, there are several important reasons why direct drive engines remain the standard in aviation.
As we previously calculated, the power density of direct drive aircraft engines is about 0.5 hp/cubic inch. Automotive engines have much higher power densities. However, there are other reasons why direct drive engines are used in aircraft. High rpm engines require a reduction gear (transmission). This adds weight and complexity. Direct drive engines do not need a transmission. As a result, they are actually lighter overall despite their lower power density. They are also more reliable because there are fewer moving parts. Additionally, the lower power density of direct drive engines allows is to be air cooled. Higher power densities require liquid cooling, which requires additional components and additional weight.
Another useful metric is the power-to-weight ratio. The Lycoming O-320, with all accessories, has a dry weight of about 270 pounds and produces 160 horsepower, giving it a power-to-weight ratio of 0.6 hp/lb. The larger O-540 weighs approximately 390 pounds and delivers 260 horsepower, yielding 0.7 hp/lb. The Rotax 912, which includes a reduction gearbox and liquid cooling, weighs 125 pounds and produces 100 horsepower, yielding 0.8 hp/lb. While this is slightly higher than the Lycoming engines, the improvement is not 240% higher.
The Rotax engine includes a reduction gear and liquid cooling without a significant compromise in weight or reliablity. As an added benefit, the higher rpm allows unleaded lower octane automotive fuels to be used in Rotax engines. Direct drive engines running at lower rpm need additives to increase the octane rating to prevent engine knocking.
Summary
So, here are the takeaways from this analysis:
- Shaft power output is a product of intake air density (which is controlled by manifold pressure) and rpm. It does not matter if it is a constant speed prop or fixed pitch prop – power is the product of these two quantities.
- Direct drive engine are often limited to 2700 rpm. At this rpm, the power density works out to 0.5 hp/cubic inch of displacement.
- Automotive engines and Rotax engines use a gear reduction, allowing the crankshaft to spin faster. This allows the power density to be higher. In the Rotax 912, at 5800 rpm, the power density is 1.2 hp/cubic inch.
- The efficiency of most engines is about 30%. The energy content of most gasolines is about 20MJ/lb. The density of most gasolines is about 6 lb/gal. Combining all of these, we can say that 1 gal/hr of fuel flow should produce about 12.5 hp of shaft power.
It’s important to point out that crankshaft power is not the same as propulsion power. The propeller efficiency factors into how the crankshaft power is converted into propulsion power. We will look at this in the next article.
Leave a Reply